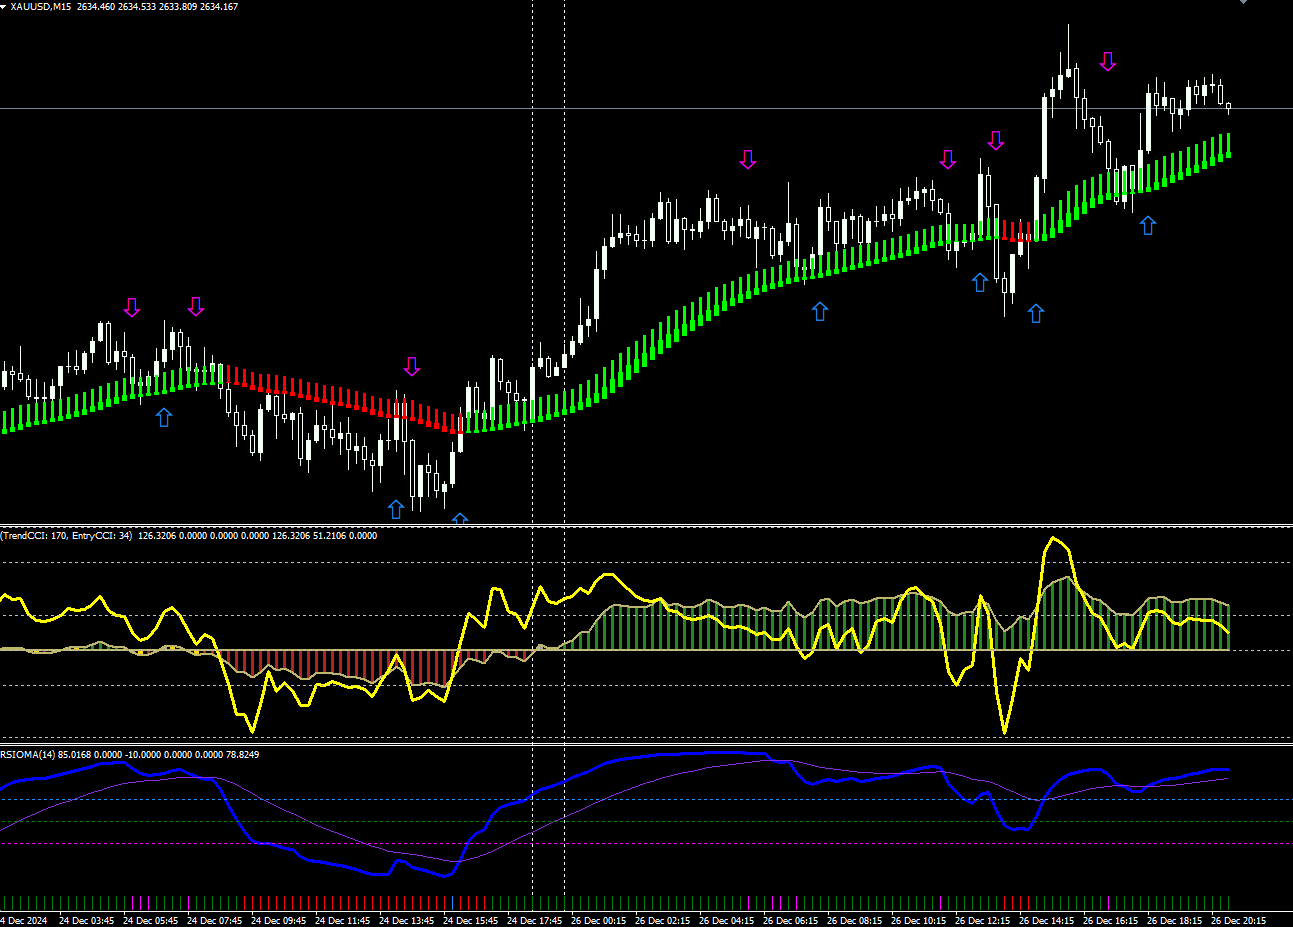
I will show you a system that is very useful and gives great trading opportunities. And as always, I will share with you the indicators and template we use at the end of the article.
This system works in the metatrader4 terminal.
It is called “Double CCI and RSIOMA” Forex Scalping Strategy. It works by using several premium indicators together effectively. Below you can see how it looks in general.
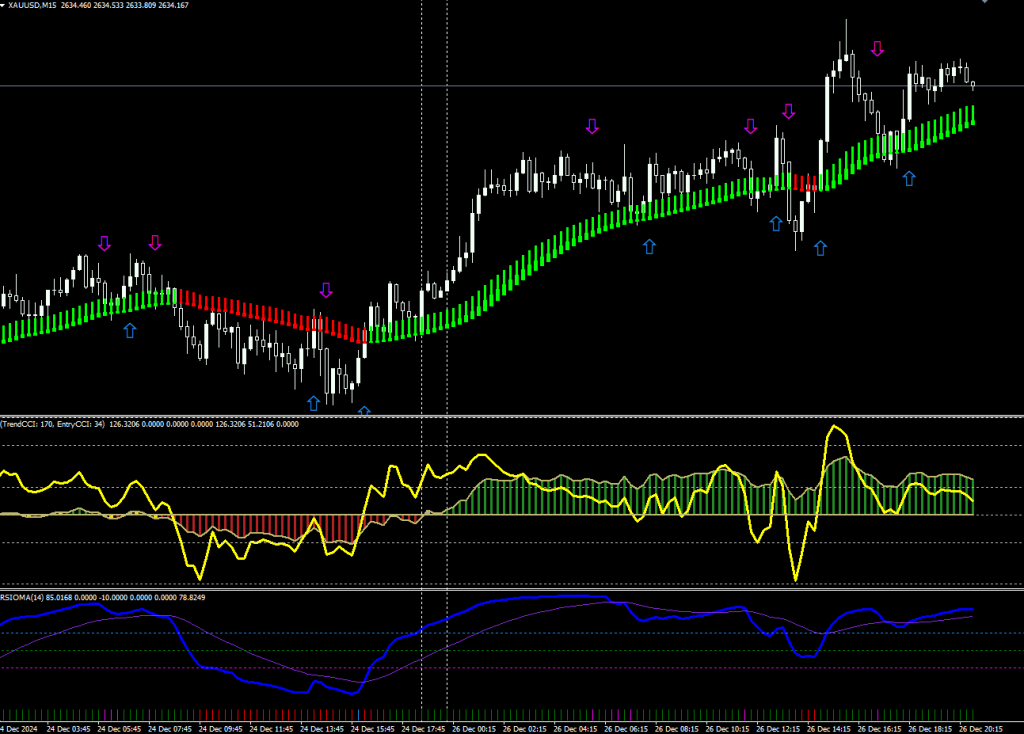
When you open the template I gave you, it will look like this. If you don’t like it, you can make color corrections from the indicator settings.
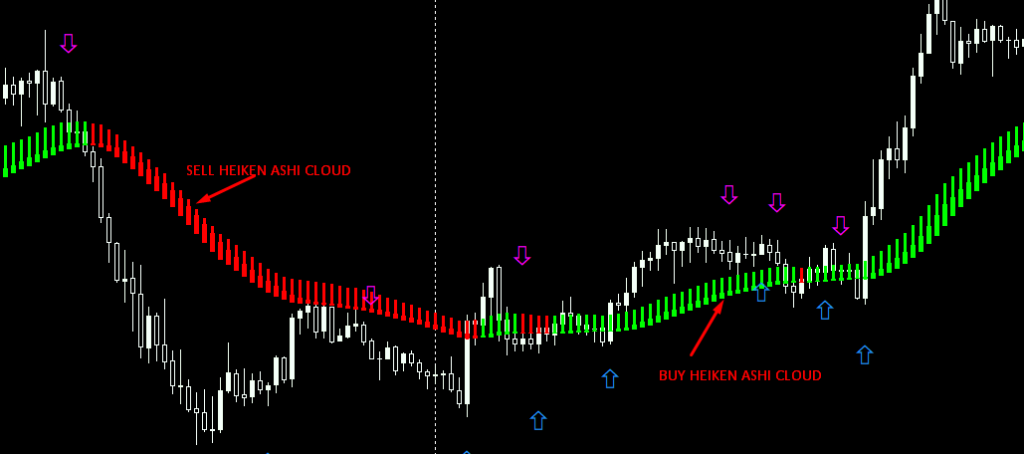
The first important part of the strategy is the “heiken-ashi-exit” indicator. It is the indicator that shows the trend direction in green and red colors that you see on the screen.
As it looks, it shows us the direction of the trend and allows us to keep our trade in the direction of the trend safely.
Red stripes show the SELL trend, green stripes show the BUY trend.
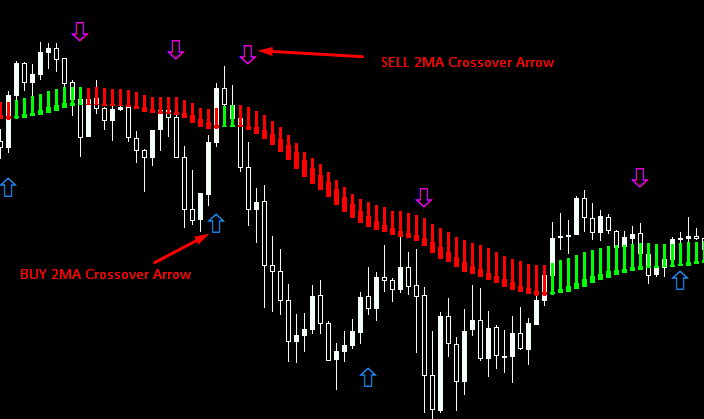
The other indicator for the strategy is the “2MA Crossover” indicator.
This indicator is related to the intersection of 4 EMA and 8 EMA by default.
When these moving averages intersect in the SELL direction, a purple arrow will appear on the screen, and when they intersect in the BUY direction, a blue arrow will appear on the screen.
The indicator is prepared as 4 and 8 EMA by default. However, you can change these from the settings. The indicator has a very flexible structure. In addition, you receive an alert signal after each intersection.
You can turn this off if you wish. Because the periods of 4 and 8 EMA are small, they will intersect too much. Alert notifications will bother you after a while.
Our other indicator is the “Doublecci Woody” indicator opened in the lower window. The indicator works like an oscillator. Red clusters represent SELL pressure. Green clusters represent BUY pressure.
The yellow line can be thought of as a general market projection according to the aggressiveness of the candles.
The indicator has different levels within itself. Above +100 represents “overbought”, below -100 represents “oversold”.

Our last indicator is called “RSIOMA v2” and appears at the bottom. This is a slightly more advanced and differentiated version of the RSI indicator that we know.
The moving average in “dodgerblue” on the indicator is the BUY trigger. The moving average in “magenta” is the SELL trigger.
Our trade entry strategy will vary depending on the intersection of these two moving averages in different colors and where they occur.
The 65 level and above on the indicator represents BUY pressure, and the 35 level and below represents SELL pressure.

BUY Trade Example
You can do your own backtests for the entries. Or you can make some changes to the indicator settings. However, I will show you how to get the best entries according to my own tests.
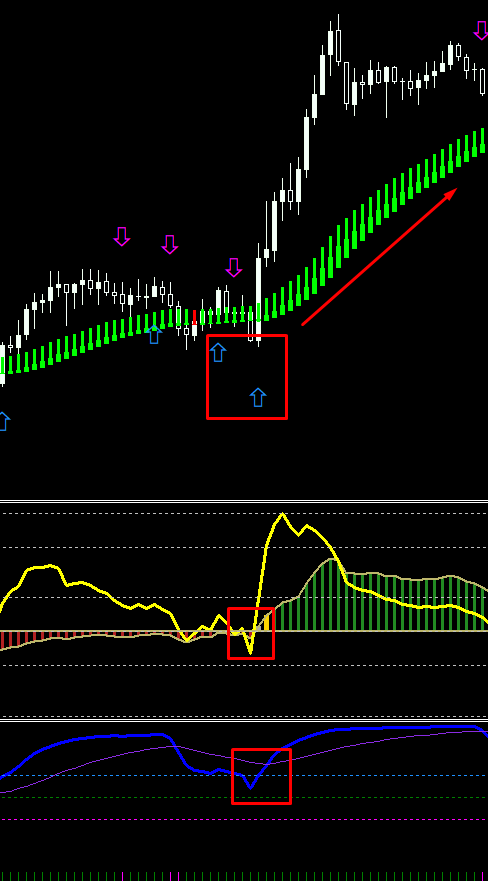
As you can see in the example above, the blue 2 MA Crossover arrows in the BUY direction have started to form. Then I check the Doublecci CCI. The yellow line has risen above the 0 level.
The Heiken Ashi indicator shows us that the trend is long in the form of green clouds.
Finally, if we look at the RSIOMA indicator, the dodgerblue moving average is starting to rise above the 65 level. The magenta moving average is above the 65 level.
And after a while, these two moving averages intersect. This gives us an extra confirmation.
Do you understand the main logic? Not everything has to be picture perfect.
Especially on range days, such extra confirmations will be very healthy. Because whether you accept it or not, the market makes 50% range and 50% trend movements. (roughly speaking)
SELL Trade Example
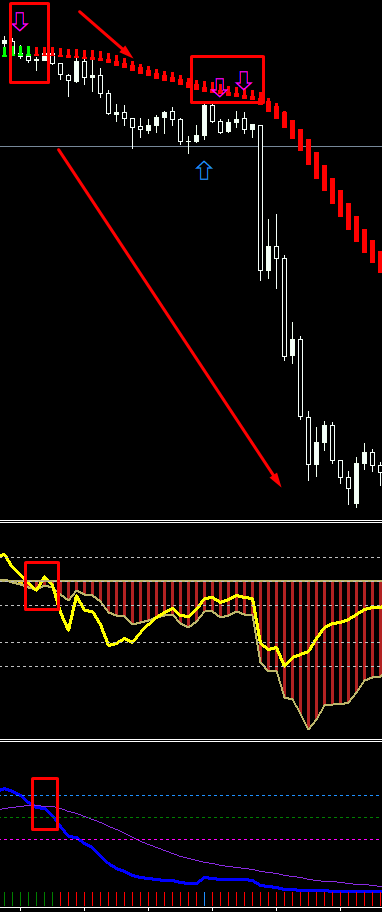
As you can see in the example above;
SELL 2 MA Crossover arrows started to form.
The color of the Heiken Ashi Exit indicator changed from green to red. And it shows us that the direction of the trend has changed.
In fact, look at the candles. The candles are also aggressively moving away from the green-red indecisive change zone.
The Doublecci CCI yellow line started to fall below the 0 level. Red clusters are starting to form afterwards.
Moving averages intersected in RSIOMA. And the angle between them is increasing and they are moving rapidly towards the 50-35 levels.
We can say that A+ is a SELL setup.
How do we determine TP and SL levels?
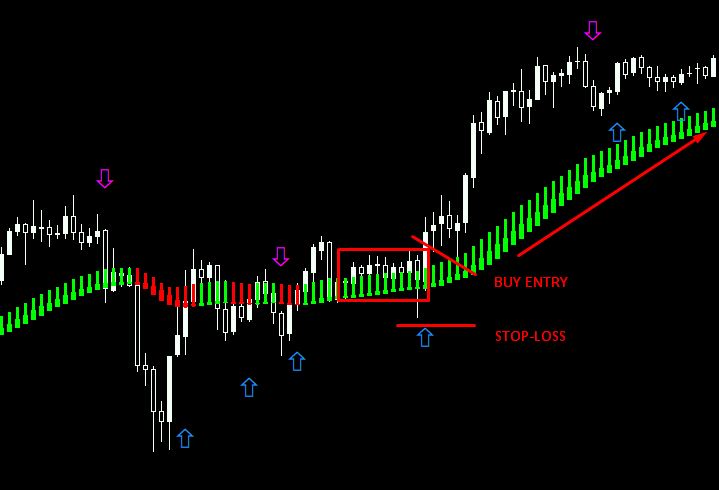
You can determine it as in the example below. After making sure that the A+ setup is formed, put your stop-loss under the structure.
TP can be held until the most appropriate place according to the traffic on the left, together with the “heiken ashi exit” green cloud cluster.
This green cloud cluster gives us extra confidence and we continue to continue the position in the direction of trade.
What timeframes does the strategy work in?
According to my tests, the strategy works well on M5 and M15 timeframes. You can do your own backtests for higher or lower timeframes. I don’t know how it works on other forex pairs. I do all my indicator and strategy reviews on xauusd.
Which broker should I trade with?
My broker recommendations will change depending on your country of citizenship. However, I only use 1 broker. And in my opinion, it is the best broker for xauusd.
I have no intention of turning this place into a billboard with 100+ brokers referring to it as “best forex brokers“. lol
If you sign up through the link below, you will not pay a commission per lot size, exclusive to the xauusd trading family. And your spreads will be very tight.
I just saved you thousands of dollars in the long run. Thank me later.
You should open an STP account. You can try by trading on a demo account.
And finally, I aggressively grow your small forex accounts using my own system. I suggest you check it out here.
See you in another premium strategy-indicator review article.
