“Shved Supply & Demand Indicator”. This indicator automatically draws support-resistance areas on the chart. Or to put it more accurately, it automatically draws supply and demand zones.
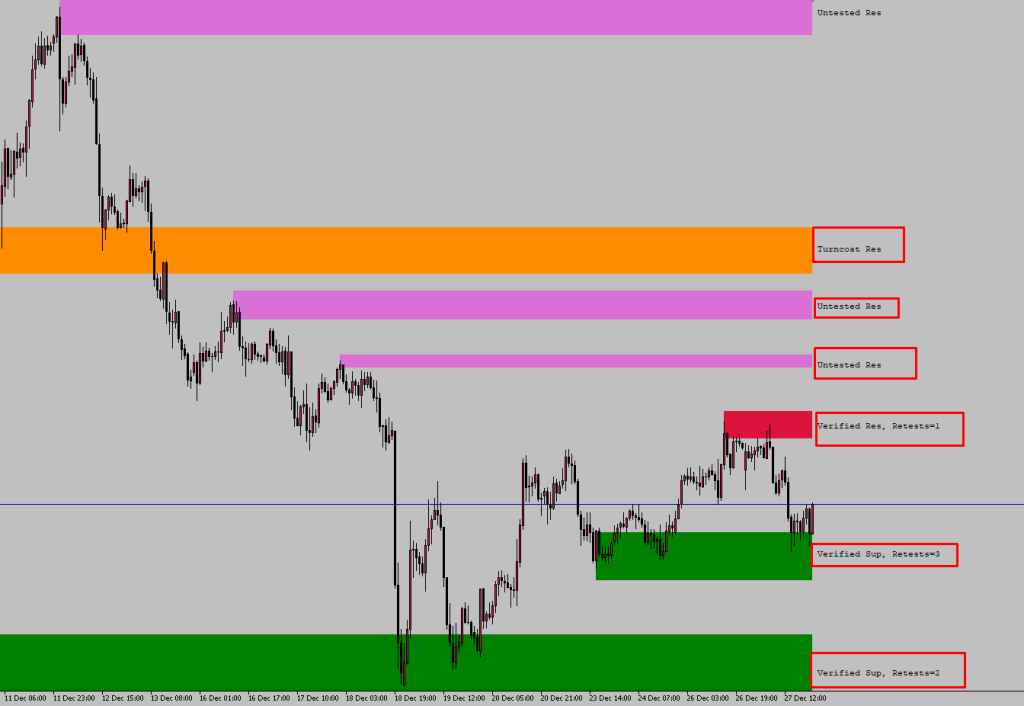
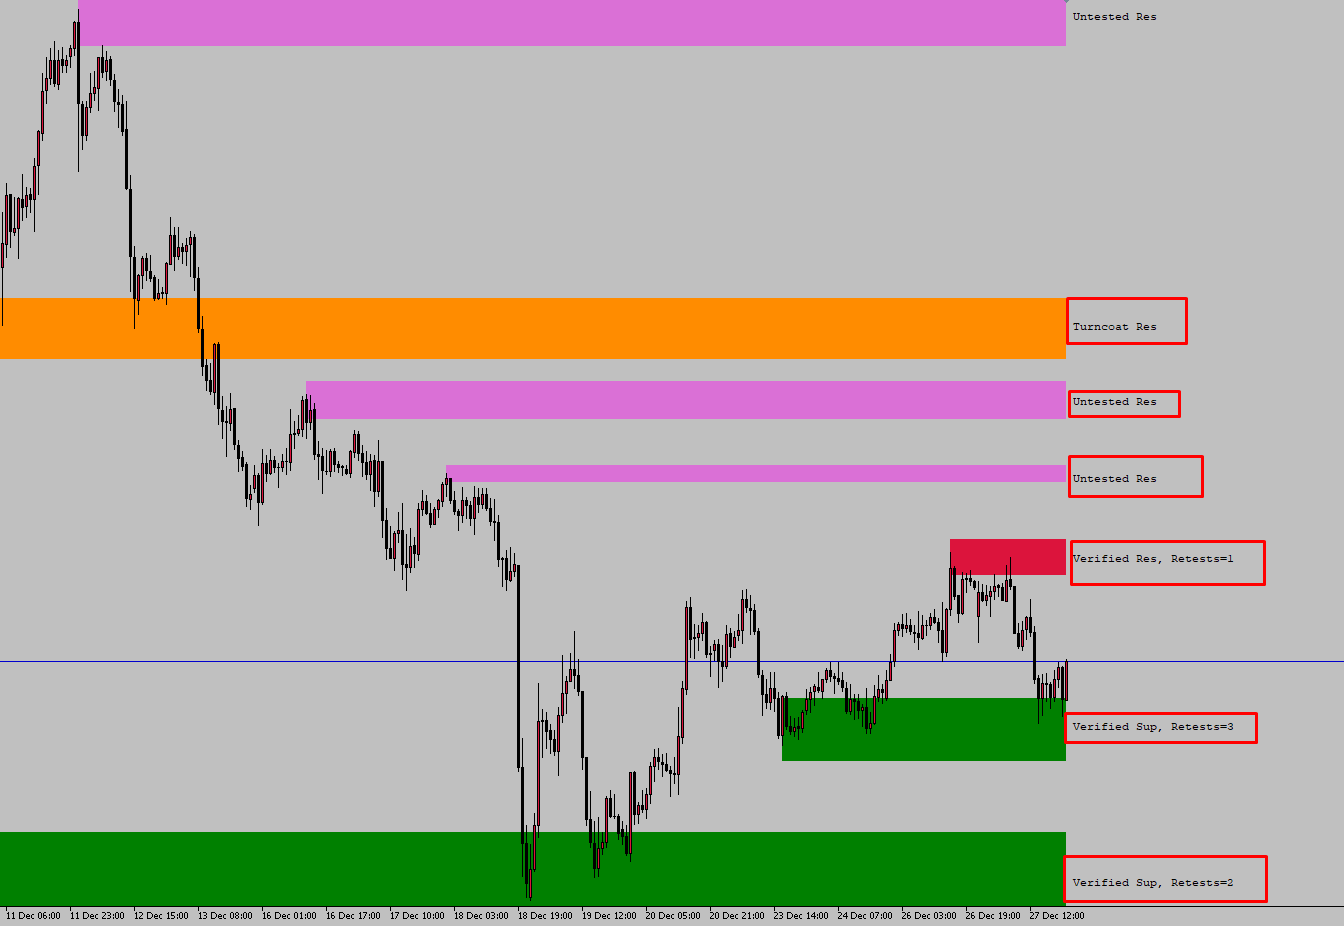
It looks like this. Is it useful? Well, we’ll have to talk about this a bit.

The indicator works in your MetaTrader5 terminal. In each timeframe, it draws supply and demand zones on the chart in accordance with that timeframe.
Therefore, do not expect to see the zone you see in the M5 timeframe in M15.
The indicator offers you many features that you can change the settings and colors. You can change them from the “indicator settings”.
If you do not like the zone colors, you can make corrections here. I will not go into these details here and will examine the indicator with its default settings.
What type of zones does the Shved Supply and Demand Indicator draw?
The indicator shows 5 different zones on your chart. You can close the zones you don’t like from the indicator settings.
1- Weak Zone: As the name suggests, “weak”. Weak support – weak resistance. We shouldn’t trade in these zones. Because it’s hard to know if the price will break or respect this zone.
Frankly, I would close this zone setting on my indicator. You should avoid a very noisy chart. It doesn’t really matter.
2- Untested Zone: This is a nice zone. You know, I examine all the indicators in xauusd. Xauusd likes to come back to previously untested zones and test them. You will want to see the untested zone on the screen.
Another information is that all pairs containing USD like to come to test key levels and untested zones. Because there are a lot of pending orders in these zones.

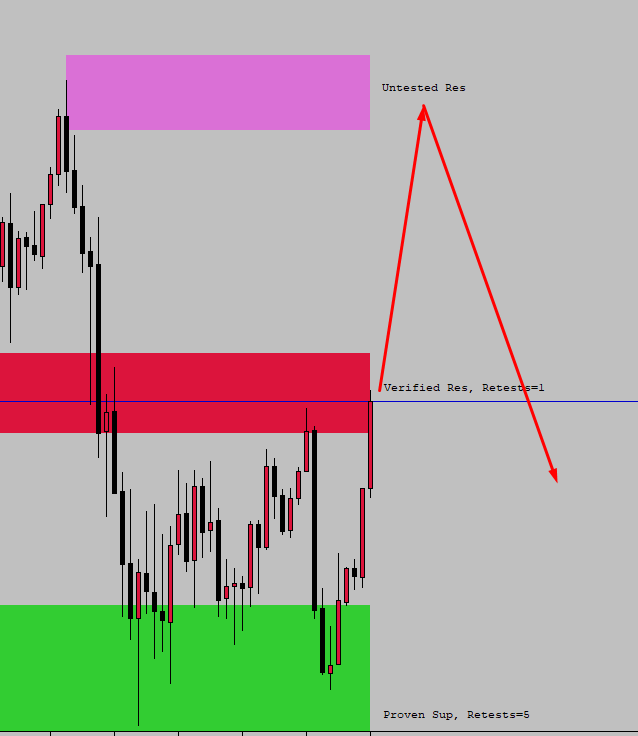
3- Verified Zone: already tested (verified) level. The indicator even shows how many times the price has come to this zone and how many times the zone has been tested.
In this way, you can directly detect strong zones without manually drawing them.
4- Proven Zone: This is a zone that has proven itself over and over again. Usually, the “retests” value is more than 2. You can see values like 4 or 5 here. If you are going to use this indicator, definitely leave the “proven zone” setting on.
The price will usually bounce between these zone areas. Because even though it has been tested more than 2 times, the fact that the price still respects this zone should be a sign to you.
5- Turncoat Zone: I think this is the most important zone feature that “Shved Supply & Demand Indicator” provides us. I will explain why. I test all indicators on xauusd. xauusd likes to come to retest at key levels.
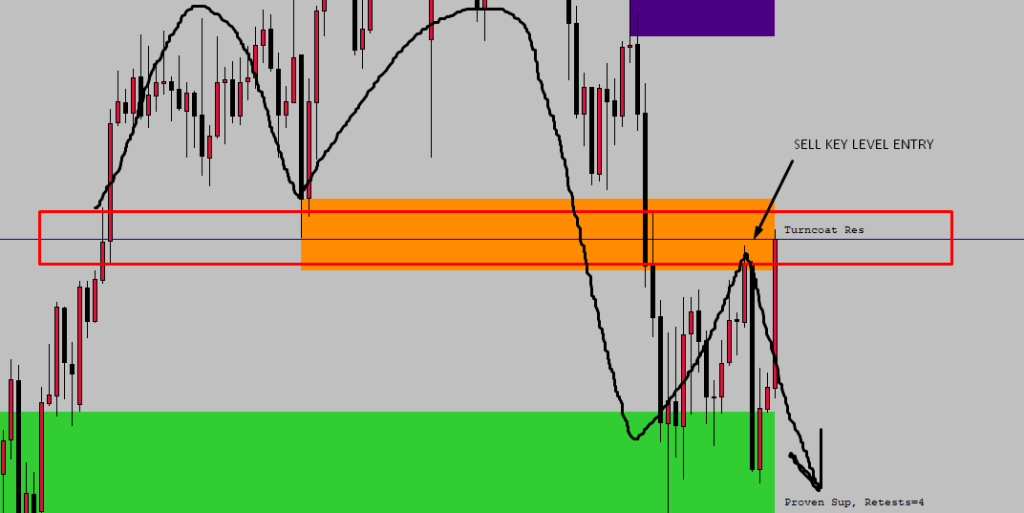
Turncoat zone is formed when the price breaks the zone that previously worked as support(or resistance) without respect when it tests this zone next time.
So what will happen in this case? This turncoat zone will be called “key level” and if the price comes to this zone again, you can search for a trade entry.
Isn’t it clear? The example below will explain the situation clearly.

How to use the Shved Supply and Demand Indicator?
Frankly, I recommend using this indicator only as an auxiliary equipment. Unfortunately, it is insufficient as a trading strategy. I think all indicators are insufficient on their own. However, I continue to examine these indicators in case they are useful to your arsenal.
I do not use any of them myself.
The indicator can draw zones with very large pips amplitude. Such large zones do not have much meaning. Therefore, I recommend you to use it in M5, M15 timeframe.
It will be more useful for scalpers.
It will be a useful indicator for traders who do not want to draw zones manually, whose main strategy is not related to zones, but still want to see where the zones are quickly.
See you in the next premium indicator reviews.
And finally, I aggressively grow your small forex accounts using my own system. I scale your balance of $500 to $1500-$5000 in a short time. I suggest you check it out here. And say hi to me.
