The volume profile indicator is a very useful indicator. Frankly, I like it very much. I especially like it because it shows you real support-resistance areas without tiring you.
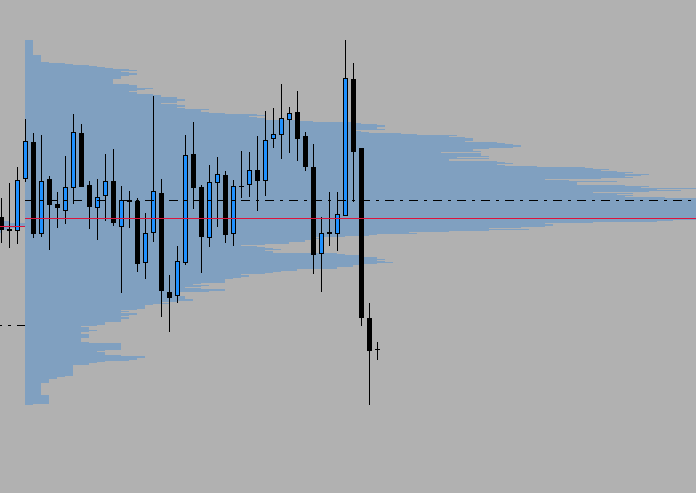
In the volume indicator, the places where the volume is the most are the places with the longest profiles. The price has been delayed a lot in these areas, which means there is a lot of volume accumulation in those areas.
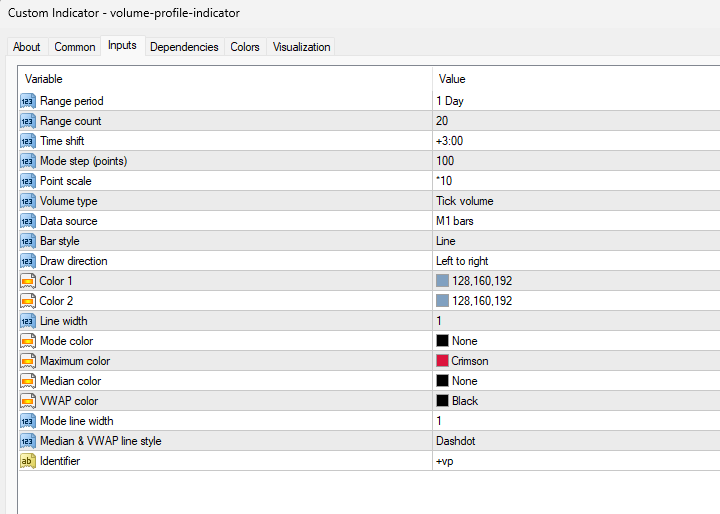
The indicator has many settings, especially in terms of color and appearance. I will not go into all of them in detail. If you want to use it the way I use it, the settings are as follows.

The indicator takes the volume directly from your forex broker as tick volume. It acts according to the volume given to you by your forex broker.
Therefore, it would be much better to use it when trading with a good and big broker. This is the broker I recommend to you.
The red line on the chart gives a single price level where the volume is highest.
The black dashdot line represents VWAP. (volume-weighted average price)
The red line, which is the highest volume level, and the VWAP, which is drawn in the form of a dashdot, are generally at close levels.

How to use the Volume Profile Indicator?
Frankly, I will show it completely in my own style.
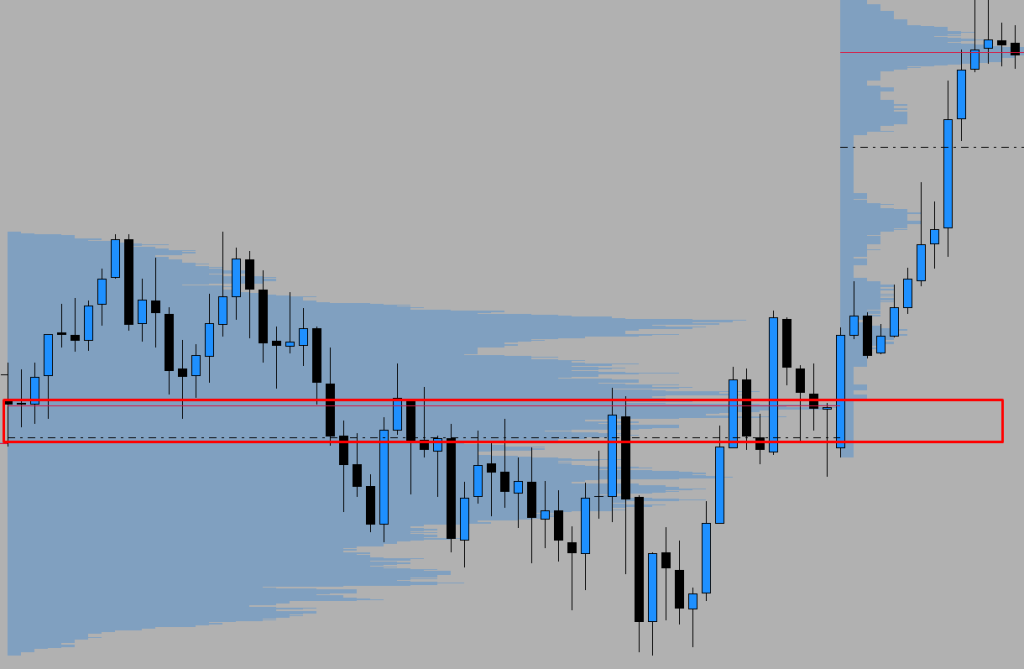
The price range between VWAP and the highest volume is the price range with the highest volumes for me. And this area acts as a strong support-resistance.

Can you see how the candles work as support and resistance in this area?
So how do we enter the trade? Honestly, I wouldn’t enter the trade based on the volume profile alone. However, if you want to enter, we should examine the price behavior in this area between the VWAP and the price level where the volume is highest.
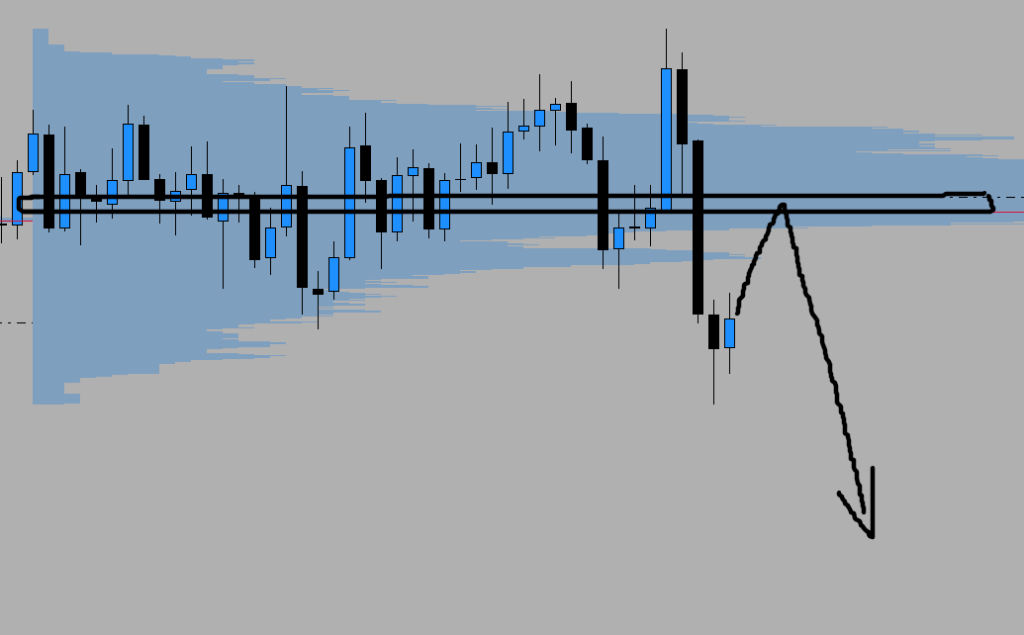
In the example below, this “strong volume” area was broken with a strong candle. In this case, if you remember the simple market structure, it is very likely that the area that previously worked as support is broken and the price comes to this area, it will now work as resistance.
In this case, if the price comes to retest this area again, we can consider a trade in the direction of SELL.
I usually call this “key level”. As you know, I try all the indicators in xauusd. In this case, I can say that xauusd loves to come to retest key levels.

What timeframe should I use the Volume Profile Indicator?
My advice to you, if I were to say specifically for xauusd, would be to use it in M5, M15 timeframes. According to the tests I have done, the volume profile indicator gives the best entry opportunities in these timeframes.
As I said, I do not recommend using the volume profile indicator as a trade strategy alone. It would be better to add strength to your own existing strategy or test it with a strategy you will develop.
Nevertheless, it is a powerful indicator in every way and instantly calculates the tick volumes it receives from the broker on a tick volume basis and visually displays them on your chart.
Which broker should I trade with?
My broker recommendations will change depending on your country of citizenship. However, I only use 1 broker. And in my opinion, it is the best broker for xauusd.
I have no intention of turning this place into a billboard with 100+ brokers referring to it as “best forex brokers“. lol
If you sign up through the link below, you will not pay a commission per lot size, exclusive to the xauusd trading family. And your spreads will be very tight.
I just saved you thousands of dollars in the long run. Thank me later.
You should open an STP account. You can try by trading on a demo account.
And finally, I aggressively grow your small forex accounts using my own system. I suggest you check it out here.
See you in another premium indicator review article.